visualising performance
Notes on how to visualise flame graph
April 13, 2022 · 1 min read · tech, programming
interesting:
- Flame graphs don’t show sequentiality. They are not sorted based on time. They are sorted by alphabets. Which means in the flame graphs, if
eg.
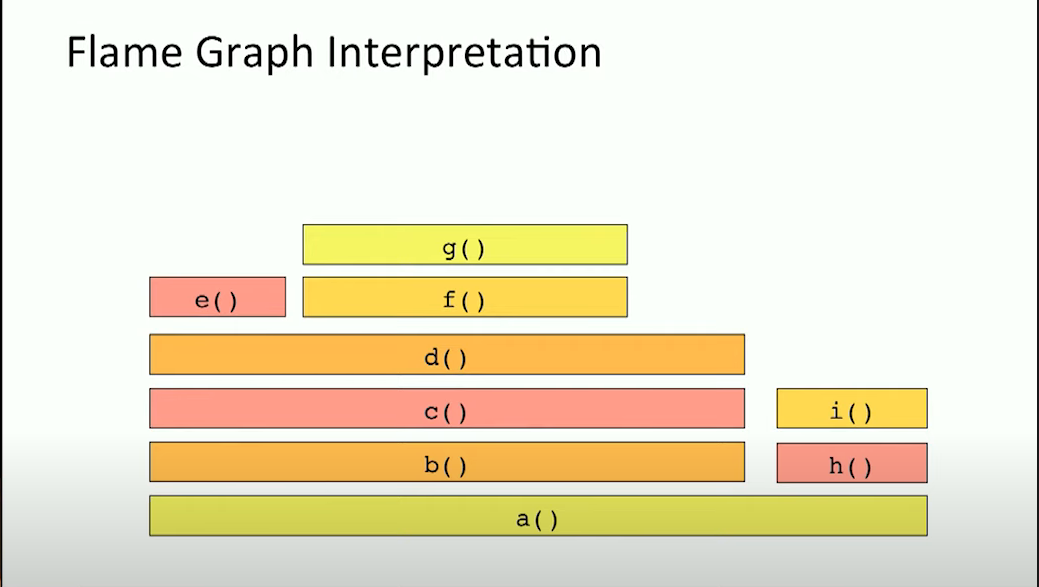
here, the function h() was not run after b(). it’s after b() because it’s alphabetically after h()
the colours can either be random or provide another dimension (eg. sys calls in red)
Inlining code, makes it difficult to do debugging. JAVA has options to Inline code 9 levels deep. Which means we just make it impossible to debug. Inlining is a compiler optimisation
JIT languages are hard to keep track of.